How to Use Fibonacci Retracement in Options Trading
Introduction
In the world of technical analysis, few tools are as revered and widely used as Fibonacci retracement levels. Whether you’re trading stocks, forex, or options, these levels serve as powerful markers of support and resistance—providing highly actionable entry and exit points. For options traders, Fibonacci retracement is more than just lines on a chart; it's a strategic roadmap that helps structure trades with precision and manage risk efficiently.
In this comprehensive guide, we’ll explore how Fibonacci retracement levels can enhance your options trading strategy. You’ll learn the basics of Fibonacci, how to apply it in the options context, and real-world case studies that show its effectiveness. If you’re someone striving to break out of the rat race and achieve financial freedom through self-sufficient trading, mastering this tool could be a game changer.
Section 1: Fibonacci Basics
1.1 What Is Fibonacci Retracement?
Fibonacci retracement is a method of technical analysis based on the idea that markets retrace a predictable portion of a move before continuing in the original direction.
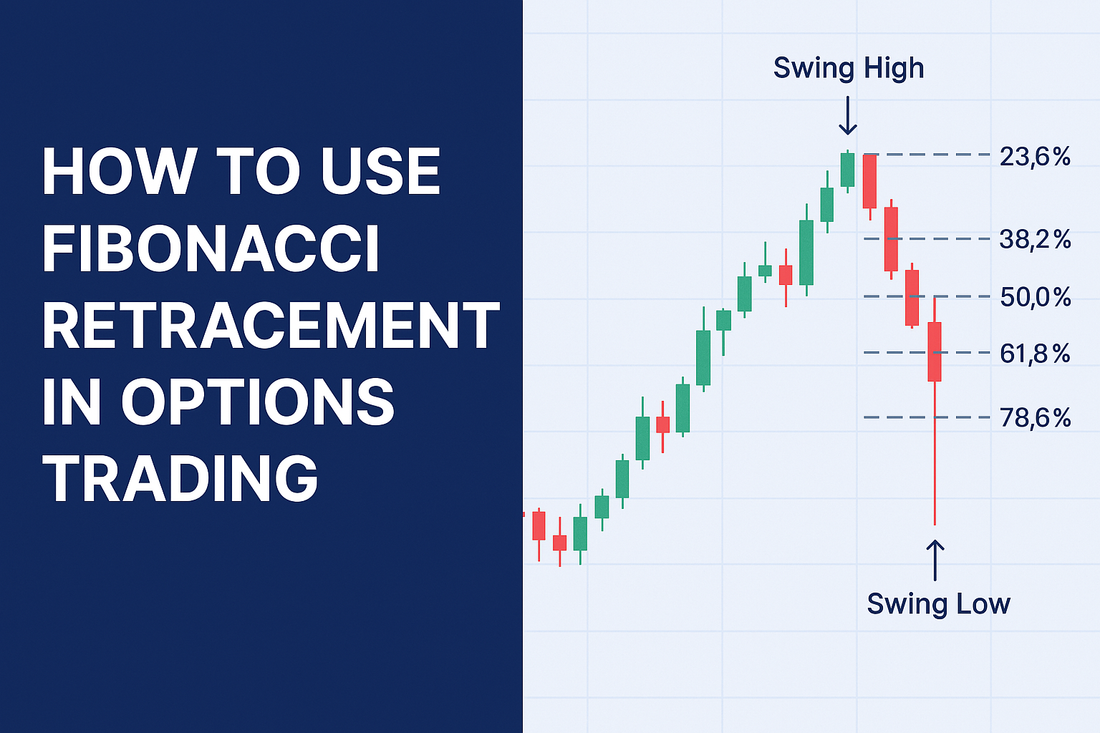
These levels are derived from the Fibonacci sequence—a series of numbers where each number is the sum of the two preceding ones (e.g., 0, 1, 1, 2, 3, 5, 8, 13...). From this, we get ratios like:
- 23.6%
- 38.2%
- 50.0% (not Fibonacci but widely used)
- 61.8%
- 78.6%
These percentages are projected on price charts to identify potential reversal zones after a strong price move.
💡 Backlink: Use Technical Indicators for Entry and Exit
1.2 Why Fibonacci Works
- Psychological Anchoring: Many traders use the same retracement levels, creating self-fulfilling prophecy.
- Natural Market Rhythm: Fibonacci reflects the proportionality often observed in financial markets.
- Universal Across Timeframes: Works on intraday, daily, weekly, and even monthly charts.
1.3 How to Draw Fibonacci Retracement
To draw the levels:
- Identify a significant swing high and swing low.
- Draw the Fibonacci tool from high to low in a downtrend, or low to high in an uptrend.
- The tool will automatically generate the retracement levels.
📈 Illustration: Price chart with Fibonacci retracement levels marked

Section 2: Applying Fibonacci to Options Trading
2.1 How Options Traders Can Use Fibonacci Levels
Options trading is all about predicting movement, timing entries, and structuring risk-reward. Here’s how Fibonacci enhances that process:
✅ Entry Points
- 38.2% and 61.8% levels are great for buying call or put options on pullbacks.
- Confirm with candlestick patterns, RSI, or MACD for higher accuracy.
✅ Exit Points
- Use retracement levels as profit-taking targets or trailing stop guides.
- Great for closing positions before premium erosion accelerates.
✅ Support for Credit Spreads
- Place credit spreads (e.g., bull put spreads) below key retracement levels in an uptrend.
- Odds increase that price will stay above that level until expiration.
💡 Backlink: Advanced Options Strategies – Spreads and Combinations
2.2 Matching Options Strategies with Fibonacci
|
Fibonacci Zone |
Trend Direction |
Ideal Options Strategy |
|
38.2% Pullback |
Uptrend |
Buy Call / Bull Call Spread |
|
50.0% Pullback |
Uptrend |
Buy ITM Call / Bull Put Spread |
|
61.8% Pullback |
Uptrend |
Diagonal Call Spread / Long Call |
|
23.6% Pullback |
Downtrend |
Sell Call / Bear Call Spread |
|
78.6% Pullback |
Reversal Zone |
Buy Put / Bear Put Spread |
💡 Tip: Combine Fibonacci with volume analysis and momentum oscillators for stronger confirmation.
Section 3: Case Studies – Real Trades Using Fibonacci
Case Study 1: SPY Call Option from Fibonacci Bounce
- Setup: SPY rallies from 400 to 420. Price pulls back to 411 (~38.2% retracement).
- Confirmation: Bullish engulfing candle + RSI > 50
- Trade: Buy 2-week ATM call option @ $3.00
- Exit Target: Near 420 (previous high)
Result: Price rebounds from 411 to 419. Option premium jumps to $5.20
Return: +73% in 5 trading days
Case Study 2: TSLA Bear Put Spread after 61.8% Rejection
- Setup: TSLA falls from 270 to 250, retraces to 261 (61.8% level)
- Confirmation: Price stalls + MACD bearish crossover
- Trade: Buy 260 put / Sell 250 put spread with 3 weeks till expiration
- Net Debit: $3.50
- Max Profit: $6.50
Result: TSLA returns to 251 in 8 days
Spread closes for $6.00
Return: +71%
Case Study 3: NVDA Bull Put Spread at 38.2% Support
- Setup: NVDA climbs from 280 to 320. Pulls back to 304 (~38.2%)
- Trade: Sell 300 Put / Buy 295 Put (bull put spread)
- Premium Collected: $2.00
- Max Loss: $3.00
Outcome: NVDA bounces to 318
Spread expires worthless
Return: +66.7%
Section 4: Combining Fibonacci with Other Indicators
4.1 RSI (Relative Strength Index)
- Look for Fibonacci pullback + RSI above 50 = Long signal
- Fibonacci + RSI divergence can signal reversal
4.2 MACD (Moving Average Convergence Divergence)
- Confirm entries when MACD crosses above signal line near 38.2% or 61.8%
4.3 Candlestick Patterns
- Watch for:
- Hammer at 61.8% (bullish)
- Shooting star at 38.2% in downtrend (bearish)
- Engulfing patterns as confirmation triggers
Section 5: Mistakes to Avoid with Fibonacci in Options Trading
❌ Blindly Trusting Levels
Always use confluence with trendlines, volume, or price action. Fibonacci is a tool—not a guarantee.
❌ Overloading Timeframes
Stick to 1–2 key timeframes. Conflicting levels on 15m, 1h, 4h, and daily can cause analysis paralysis.
❌ Using Weekly Expiry for Swing Setups
Options close too quickly to allow swing trades time to develop. Choose 2–4 week expirations.
💡 Backlink: Learn How to Backtest Your Options Strategies
Section 6: Tools to Draw Fibonacci in Your Trading Platform
Popular Platforms with Fibonacci Tools:
- ThinkOrSwim (TOS) – Dynamic retracement and extension tools
- TradingView – Customizable and multi-timeframe overlays
- Tastytrade – Chart integration and probability overlays
- Interactive Brokers – Reliable charting with advanced studies
Section 7: Journal and Track Your Fibonacci Trades
Logging your trades is essential for performance review.
What to Track:
- Symbol and time frame
- Entry/exit levels
- Option strategy
- Fibonacci zone used
- Indicators confirming the setup
- Result (profit/loss)
- Lessons learned
💡 Backlink: Managing Your Options Trading Journal
Section 8: Final Thoughts – Fibonacci as a Strategic Map
Fibonacci retracement is more than a prediction tool—it’s a strategic compass that helps guide your trades. By integrating Fibonacci into your options framework, you can:
- Time your entries with greater confidence
- Structure trades with optimal reward-to-risk profiles
- Use spreads and hedges aligned with market structure
- Avoid chasing and focus on pullback-based precision
Whether you trade directional calls/puts or complex spreads, using Fibonacci retracement adds context, control, and clarity to your strategy.
📣 Increase Your Odds of Success
At www.optionstranglers.com.sg we offer:
- ✅ In-depth live 1-1 sessions / group classes
- 📊 Trade examples and breakdowns
- 👥 Community mentorship and support
👉 Ready to upgrade your strategy and trade like a pro?
Visit www.optionstranglers.com.sg and start your journey to financial freedom today.
Your future is an option. Choose wisely.
⚠️ Disclaimer:
Options involve risk and are not suitable for all investors. Always consult with a financial advisor before investing.