How to Read an Options Chain: A Step-by-Step Guide
For traders and investors interested in options, mastering how to read an options chain is a crucial first step. An options chain contains all the essential data required to make informed trading decisions, from pricing and expiration dates to strike prices and open interest. But to the uninitiated, it can look like a wall of numbers and jargon. This guide breaks down the components of an options chain, explains the key data points, and provides actionable tips to help you navigate it like a pro.
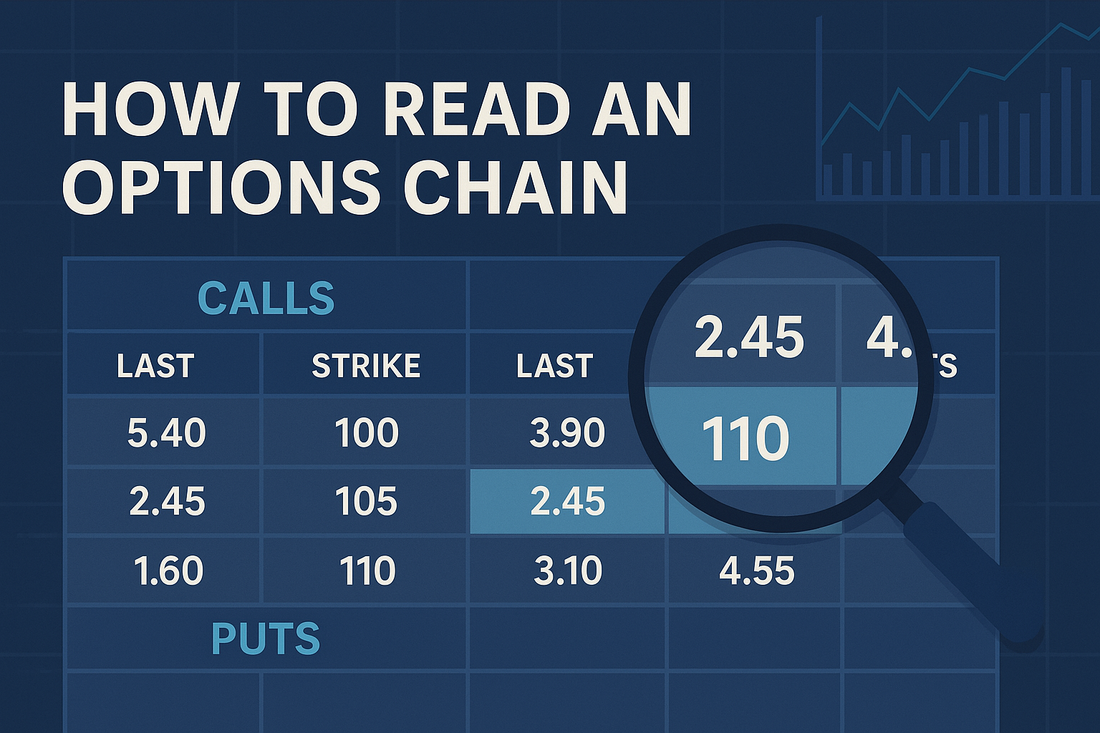
Options Chain Basics
An options chain, sometimes referred to as an "options matrix," is a table listing all available option contracts for a particular security. Each row in the chain represents a different strike price, and the columns display data for both call and put options.
1. Calls and Puts
Options come in two forms:
- Call options give the buyer the right, but not the obligation, to buy the underlying asset at a specified price (strike price) before or at expiration.
- Put options give the buyer the right, but not the obligation, to sell the underlying asset at the strike price.
The options chain splits these into two sides: calls (usually on the left) and puts (on the right).
2. Strike Prices
Strike prices are the predetermined prices at which the underlying asset can be bought or sold. The options chain usually shows a range of strike prices above and below the current market price (also called the underlying price).
3. Expiration Dates
Each option has a specific expiration date. Most trading platforms allow you to select expiration cycles—weekly, monthly, or even quarterly. The options chain then displays contracts that expire on the selected date.
Key Data Points in an Options Chain
Understanding the numerical data in each row of the options chain is vital for analyzing potential trades. Here are the most important columns you'll typically find:
1. Last Price
This is the most recent trading price of the option. While informative, it may not be the most accurate indicator of an option's current value because it reflects the last completed trade, which might be outdated in fast-moving markets.
2. Bid and Ask
- Bid is the highest price a buyer is willing to pay for the option.
- Ask is the lowest price a seller is willing to accept.
The difference between them is called the spread. Narrow spreads usually indicate high liquidity.
3. Volume
Volume shows the number of contracts traded during the current session. High volume can indicate strong interest in a specific strike price or expiration date.
4. Open Interest (OI)
Open interest is the total number of outstanding (open) contracts that have not yet been settled. Higher open interest typically suggests greater liquidity and trader interest.
5. Implied Volatility (IV)
Implied volatility reflects the market’s expectation of future price movement in the underlying asset. Higher IV increases an option’s premium, all else equal. Traders use IV to gauge how expensive or cheap options are.
6. Delta
Delta measures the sensitivity of the option’s price to changes in the underlying stock. A delta of 0.50 means the option will gain or lose $0.50 for every $1 change in the underlying.
7. Theta
Theta represents time decay. It tells you how much value the option will lose with the passage of one day, assuming all other factors remain constant.
8. Intrinsic and Extrinsic Value
- Intrinsic value is the amount the option is "in the money."
- Extrinsic value (or time value) is the portion of the premium not accounted for by intrinsic value. It decays over time.
Reading Tips for Options Chains
Now that you understand the components of an options chain, here are some best practices for interpreting the data:
1. Start with the Underlying Price
Identify the current price of the stock. This will help you determine which options are:
- In the Money (ITM): Calls with strike prices below the current price, or puts with strike prices above.
- At the Money (ATM): Strike price closest to the current stock price.
- Out of the Money (OTM): Calls with strike prices above the current price, or puts with strike prices below.
2. Use the Greeks for Deeper Insight
If you're planning a trade, analyze the Greeks. Delta helps you gauge directional bias; Theta tells you how fast time decay will eat into the premium; Vega shows how sensitive the option is to changes in volatility.
3. Assess Liquidity Through Bid-Ask Spreads and Open Interest
Avoid options with low open interest or wide bid-ask spreads. Liquidity issues can make it difficult to enter and exit positions efficiently.
4. Watch Implied Volatility
Compare implied volatility across different strikes and expirations. High IV might suggest that the market expects a big move (e.g., due to earnings or news). Some traders avoid buying options with inflated IV unless volatility is expected to increase further.
5. Filter by Expiration
Pick an expiration date that aligns with your trading goals:
- Short-term trades might benefit from weekly options.
- Longer-term positions often use monthly or LEAPS (long-term equity anticipation securities).
6. Check the Volume and Open Interest Trends
Sudden spikes in volume or open interest can signal unusual activity, which might be worth investigating further.
7. Use Multi-Leg Strategy Views
Many platforms let you build and view strategies (like spreads, straddles, or iron condors) directly on the options chain. This helps assess max profit/loss, breakevens, and Greeks for the entire position.
Annotated Options Chain Example
To illustrate how to read an options chain, here’s a sample layout (a visual screenshot would typically be included here):

- Strike Price 100 is near the underlying stock price (ATM).
- Call Option Delta 0.60 suggests a 60% probability of expiring ITM.
- Put Option at 105 has high OI and volume, possibly indicating significant interest or a hedging strategy.
Conclusion
Reading an options chain might seem daunting at first, but with a solid understanding of its components and practice, it becomes a vital tool in the options trader’s toolkit. The key is to focus on the most relevant data points—strike prices, bid/ask spreads, volume, open interest, and the Greeks—and interpret them within the context of your trading strategy.
To recap:
- Use the underlying price as your reference point.
- Focus on liquidity and pricing transparency.
- Watch implied volatility and how it affects premiums.
- Combine technical and fundamental insights for stronger trade setups.
With time, deciphering an options chain will become second nature, empowering you to make smarter, more strategic decisions in your options trading journey.
Next Step: Explore your trading platform’s options chain features and practice interpreting different setups. Try paper trading various strategies to build confidence before using real capital.
Curious about Option Stranglers? At www.optionstranglers.com.sg we offer:
- In-depth live 1-1 sessions / group classes
- Trade examples and breakdowns
- Community mentorship and support
👉 Ready to upgrade your strategy and trade like a pro? Visit www.optionstranglers.com.sg and start your journey to financial freedom today.
Your future is an option. Choose wisely.
Disclaimer: Options involve risk and are not suitable for all investors. Always consult with a financial advisor before investing.
Happy Trading!