Creating and Interpreting Options Volatility Skews: A Self-Sufficient Trader’s Guide
Keywords: volatility skew, options trading skew, implied volatility curve, volatility skew interpretation, skew trading strategies, options volatility graph
💡 Introduction: Why Volatility Skew Matters in Options Trading
Volatility is the heartbeat of the options market. But not all volatility is created equal. If you're an aspiring self-sufficient trader looking to gain financial freedom through options, understanding volatility skew can give you a serious edge.
Volatility skew tells you how option pricing differs across strike prices and how the market is pricing risk asymmetrically. It’s a subtle, often overlooked signal that reveals the bias and fear hidden beneath the surface of prices.
In this guide, we’ll explain what volatility skew is, how to interpret it using actual graphs, and how to build strategies around it to improve your trading decisions.
📘 Section 1: Defining Volatility Skew
🔍 What Is Implied Volatility (IV)?
Before we talk about skew, let’s define implied volatility.
Implied volatility is the market’s forecast of a stock’s future volatility based on options prices. It tells us how much the market expects the stock to move, not the direction.
- Higher IV = more expensive options
- Lower IV = cheaper options
📊 What Is Volatility Skew?
Volatility skew occurs when implied volatility varies across strike prices for the same expiration. Instead of forming a flat line, the IV curve tilts or bends—this is the “skew.”
There are three main types:
- Vertical skew – Difference in IV between out-of-the-money (OTM) puts and calls.
- Horizontal skew – Difference in IV between different expiration dates (aka term structure).
- Smile/Smirk skew – Shape of IV curve across strikes.
📌 Traders often focus on vertical skew because it reveals market sentiment about downside or upside risk.
📈 Why Does Skew Exist?
-
Market Fear of Crashes
Investors often buy OTM puts as protection → demand increases → IV rises. -
Speculative Call Buying
In growth stocks, OTM calls may have higher IV due to bullish speculation. -
Event Risk
Earnings reports or geopolitical risks can alter skew dramatically. -
Supply and Demand Imbalance
The options market is shaped by flows—skew often reflects where the crowd is placing their bets.
🔎 Section 2: Reading and Analyzing the Skew
📉 Plotting a Volatility Skew Graph
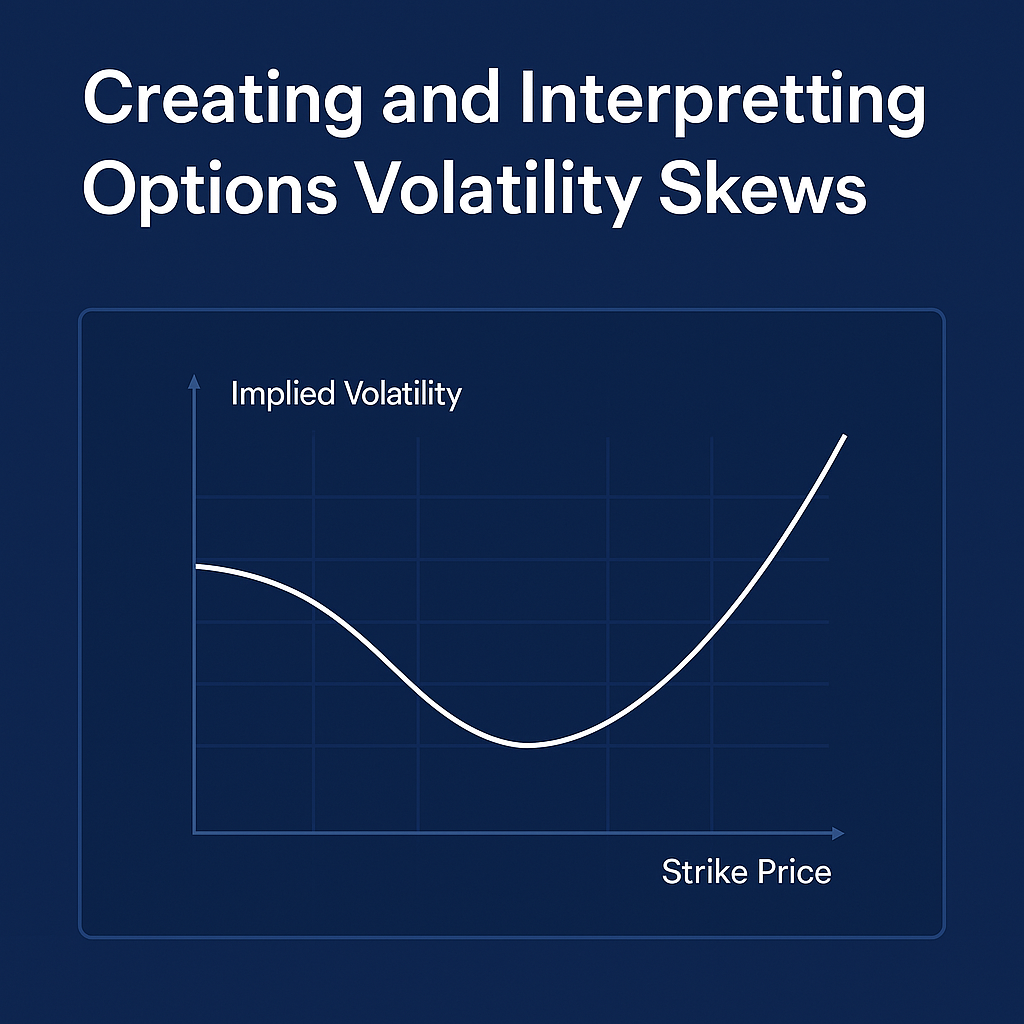
A typical volatility skew graph plots strike prices on the X-axis and implied volatility on the Y-axis.
In this example:
- IV is highest for lower strikes (puts)
- IV decreases toward ATM
- IV flattens or rises slightly for higher strikes (calls)
This is called a “reverse smirk” skew—common in indices like SPX or ETFs like QQQ.
🧠 How to Read the Skew
|
Shape |
Interpretation |
|
Flat Skew |
Market sees equal risk both directions |
|
Reverse Smirk |
Puts have higher IV → Fear of crash |
|
Forward Smirk |
Calls have higher IV → Bullish speculation |
|
Smile |
Both wings have higher IV → Volatility event expected |
📌 Use skew shape + IV Rank for strategy alignment.
📌 Real-Life Example: SPY vs. TSLA
- SPY: High put skew, flatter calls → market hedges against crashes
- TSLA: OTM calls can have high IV → speculative upside bets
Reading the skew tells you where the “insurance” premium is priced—and where traders are expecting movement.
🎯 Section 3: Trading Implications of Volatility Skews
🧭 1. Sell Premium Where IV Is High
If IV is inflated on one side of the skew:
- Sell options on that side to collect rich premium
- Buy options where IV is depressed (for cheaper directional bets)
📌 Example: In a crash-heavy skew, sell OTM puts if you’re bullish, or buy OTM calls for cheap upside exposure.
📐 2. Choose Strike Prices Strategically
Strike selection affects your edge. For example:
- Selling credit spreads? Place short leg where IV is elevated
- Buying debit spreads? Target legs with favorable skew compression
📌 Tip: Align your directional view with the skew to maximize probability and edge.
⚖️ 3. Use Skew to Adjust Risk/Reward
Skew tells you where the crowd expects action.
- If skew shows fear (high put IV), markets might be oversold.
- If call skew is high, rallies might already be priced in.
Implication: Position sizing and exits should be adjusted accordingly.
🔄 4. Skew-Based Strategy Examples
|
Strategy |
Use Case |
Skew Signal |
|
Iron Condor |
Range-bound market |
Flat skew |
|
Put Ratio Spread |
Mildly bullish |
High put skew |
|
Call Debit Spread |
Bullish breakout |
Flat or rising call skew |
|
Put Calendar |
IV normalization |
Elevated short-term put IV |
|
Straddle |
IV crush reversal |
Steep smile skew |
📌 Use tools like Thinkorswim, OptionStrat, or Market Chameleon to analyze and backtest.
💼 Section 4: Real Trade Examples Using Skew
🧪 Trade 1: QQQ Put Skew During Market Pullback
- Observation: 10% OTM puts had 20% higher IV than ATM
- Strategy: Sell put spread (e.g., sell $300, buy $290)
- Rationale: Collect inflated premium while maintaining defined risk
📈 Result: Market bounced → spreads expired worthless → full profit
🧪 Trade 2: TSLA Call Skew into Earnings
- Observation: OTM calls had spiking IV with IV Rank > 70%
- Strategy: Buy diagonal call spread
- Rationale: Long call in low IV month + short in high IV week
📈 Result: Stock rose modestly, short leg decayed fast → profitable exit
🧪 Trade 3: SPX Flat Skew Pre-FOMC
- Observation: ATM strikes showed similar IV → market uncertainty
- Strategy: Long straddle
- Rationale: Play both directions into macro event
📈 Result: 2% move post-announcement → straddle profited on gamma
📈 Section 5: Building a Volatility Skew Workflow
✅ Step 1: Screen for IV and Skew Opportunities
Use tools like:
- Market Chameleon – Skew analysis and historical patterns
- OptionStrat – Visualize IV per strike
- Thinkorswim – Custom IV skew plots
✅ Step 2: Crosscheck IV Rank/Percentile
Even if skew is present, IV should be in favorable zones:
- Sell premium when IV Rank > 60%
- Buy premium when IV Rank < 30%
✅ Step 3: Define Bias and Entry Logic
- Are you trading for direction, range, or volatility change?
- What part of the skew supports your thesis?
✅ Step 4: Execute and Track
- Log all skew-influenced trades
- Note IV changes, realized volatility, and P/L outcome
- Adjust your rules over time
📊 Skew Graph Plot

⚠️ Section 6: Common Skew Misinterpretations
❌ Skew ≠ Directional Prediction
Just because put skew is high doesn’t mean the stock will fall. It shows fear of downside—not certainty.
❌ Skew Is Dynamic
Skew can change hourly, especially around:
- Earnings
- Fed announcements
- Geopolitical headlines
Always check skew at the time of trade entry.
❌ Not All Skew Is Tradeable
Some stocks have thin options markets. Skew might be artificial due to lack of liquidity.
Stick to:
- SPY, QQQ, TSLA, AAPL, NVDA
- High open interest names with tight bid/ask spreads
🎓 Section 7: Practice Exercises for Mastering Skew
- Plot skew curves daily on your favorite stocks
- Screenshot IV changes before and after news
- Backtest trades using historical skew patterns
- Paper trade skew-based strategies for 30 days
- Journal every trade: What did skew say? What happened?
📌 Discipline + curiosity = consistent improvement.
🧠 Final Thoughts: Skew Is the X-Ray of the Options Market
Most traders just look at direction and price. But skew reveals the hidden fear, greed, and probability distributions that shape market behavior.
By learning how to read volatility skew:
- You’ll understand where the market is betting
- You’ll price risk more accurately
- You’ll gain an edge most traders ignore
Whether you’re trading spreads, calendars, or directionally, skew awareness makes every setup more intelligent.
🚀 Ready to Use Skew to Sharpen Your Strategy?
At www.optionstranglers.com.sg we offer:
✅ In-depth live 1-1 sessions / group classes
✅ Trade examples and breakdowns
✅ Community mentorship and support
👉 Ready to upgrade your strategy and trade like a pro?
Visit www.optionstranglers.com.sg and start your journey to financial freedom today.
Your future is an option. Choose wisely.
⚠️ Disclaimer:
Options involve risk and are not suitable for all investors. Always consult with a financial advisor before investing.